Supply increased while sales fell
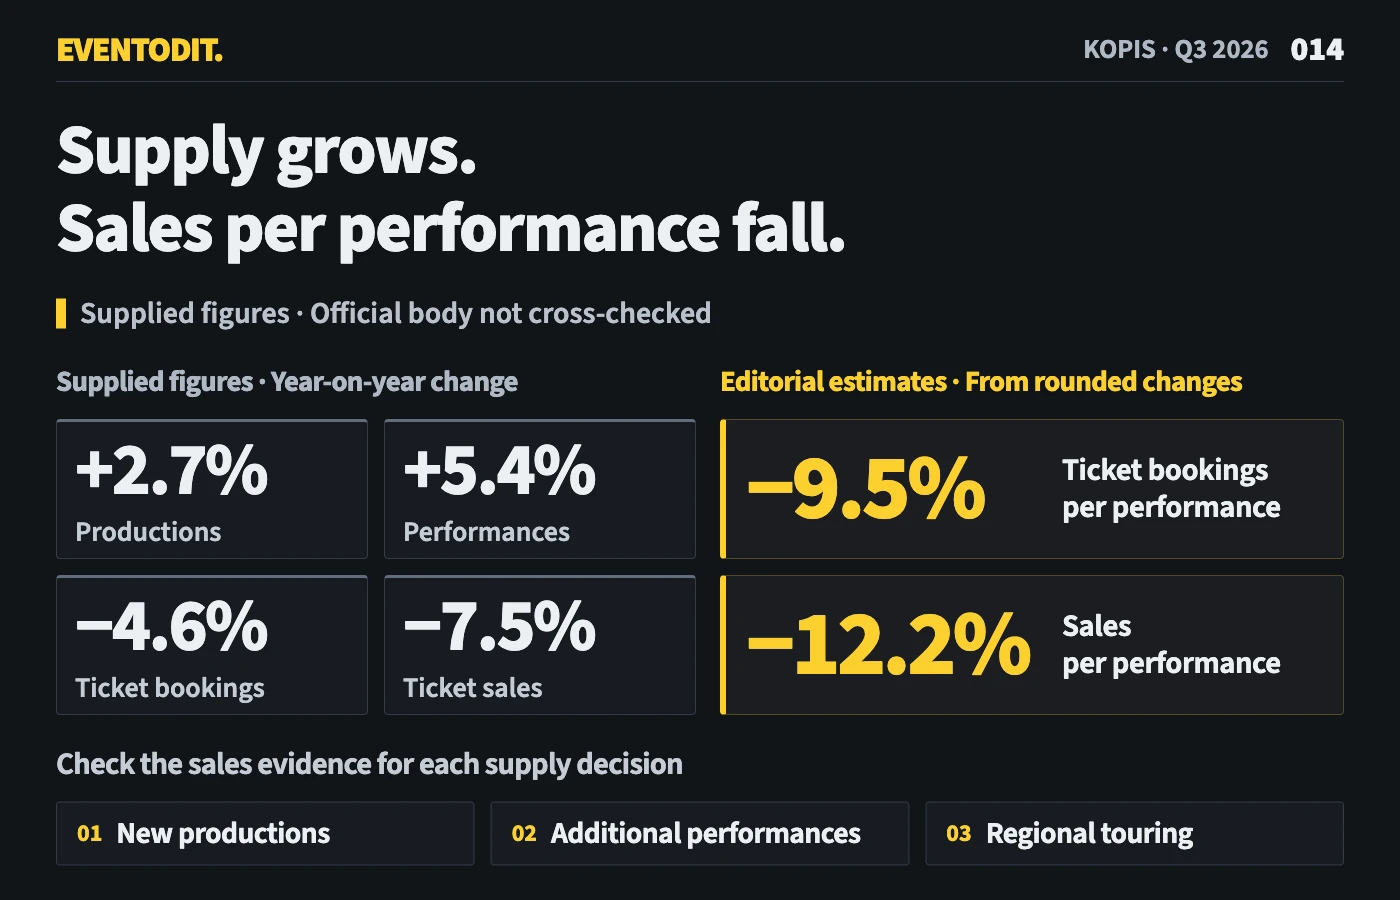
According to the material, the number of productions increased by 2.7% year on year and the number of performances rose by 5.4%. Ticket bookings, however, fell by 4.6% and ticket revenue by 7.5%. The material also states that revenue from plays increased while musical theatre revenue declined.
The central point is that supply and sales indicators did not move in the same direction. There were more opportunities to put work on stage, but a smaller share of those opportunities translated into audience purchases.
The decline is larger when measured per performance
Combining the changes in productions, performances, bookings and revenue shows how sales per unit of supply changed. The figures below are derived indicators calculated by the editorial team from rounded rates of change, so rounding may affect the first decimal place.
| Derived indicator | Calculation | Year-on-year change |
|---|---|---|
| Performances per production | (1.054 ÷ 1.027 − 1) × 100 | About +2.6% |
| Ticket bookings per performance | (0.954 ÷ 1.054 − 1) × 100 | About -9.5% |
| Ticket bookings per production | (0.954 ÷ 1.027 − 1) × 100 | About -7.1% |
| Revenue per ticket | (0.925 ÷ 0.954 − 1) × 100 | About -3.0% |
| Revenue per performance | (0.925 ÷ 1.054 − 1) × 100 | About -12.2% |
| Revenue per production | (0.925 ÷ 1.027 − 1) × 100 | About -9.9% |
Three things emerge from this calculation. First, performances increased faster than the number of productions, raising the average number of performances per production. This alone does not establish that the same productions ran for longer. Second, bookings per performance fell by about 9.5%: bookings did not keep pace with the increase in performances. Third, average sales per ticket also fell by about 3%. These data cannot separate the effects of prices, discounts and sales mix. With both bookings per performance and average sales per ticket declining, sales per performance fell by approximately 12.2%.
What these indicators can and cannot tell us
These calculations do not show the behaviour of an individual audience member or the results of a particular production. The material alone cannot tell us whether more performances came from extra weekend dates, additional weekday performances or extensions of long-running shows. Differences between plays and musicals may also have varied between individual works within each genre average.
Even so, the assumption that sales will rise in proportion to the number of performances does not fit this quarter’s material. In particular, producers should consider whether additional performances may attract fewer audience purchases than existing ones.
Check the sales evidence before starting a new production
New productions carry greater risk when sales are weak relative to supply. A new work requires upfront spending on creation, development and rehearsals. Without an existing sales record, the size of a genre average cannot stand in for demand for that work.
When considering a new production, distinguish people who respond to its introduction from those who actually buy at a specified price. Changes to scenes or technical specifications during development can affect rehearsals, production materials and adaptation onsite, so the business plan needs to allow for revisions. A small public trial or a limited premiere can be a way to test responses first. The cost of that trial should still be managed separately from the ongoing costs of the full production.
Base additional performances on sales per performance
The most direct implication of this material concerns additional performances. When bookings per performance are falling, adding dates may divide sales that would otherwise have gone to existing performances. The evidence for extra performances should therefore show how much sold, at what price, on which dates and at which times, rather than relying on a single claim that a show sold out.
Combining discounted or invitation-based sales with ordinary purchases can overstate demand for extra performances. It is useful to record purchase channels and price categories alongside sales data.
This distinction also matters to suppliers. Additional performances extend equipment use, while staffing and installation and dismantling work may accumulate by performance. A quotation based only on the increased performance count can hide these differences. Suppliers should therefore separate the work required for each performance when preparing a quote.
Be more cautious about regional touring when sales are declining
Regional touring brings the same work to another venue and another audience. When overall sales per performance are declining, evidence of demand in a new region becomes more important. Rather than carrying over success in another city, check the audience and sales channels that the local venue and partners can identify.
Before contracting, also decide who handles travel costs, installation and dismantling, local information and sales. If touring sales fall short of expectations, travel costs and fixed operating expenses still remain.
Distinguish three ways to expand supply
| Choice | Upfront preparation | Work that remains each time | Sales evidence to check |
|---|---|---|---|
| New production | Creation, development and rehearsals | Performing, onsite operations and revisions | Audience and price responses for the specific work |
| Additional performances | Preparing a repeat run and securing dates | Performing and operations for each performance | Bookings per performance in the additional time slots |
| Regional touring | Adapting to a venue and preparing transport | Travel, installation and dismantling | Purchase evidence for that region and schedule |
These choices are not mutually exclusive. However, if sales per performance are falling despite increased supply, compare each choice against sales evidence at the performance level. Looking only at totals makes it difficult to see where the actual burden accumulates.
Conclusion
This quarter’s material shows that expanding performance supply did not automatically expand sales. The number of productions rose by 2.7% and performances by 5.4%, but bookings per performance fell by about 9.5% and revenue per performance by about 12%. Producers should judge new productions and additional performances by sales trends per performance, rather than the scale of supply.
Conditions for applying this to other events
This analysis is limited to a specific period and reporting scope. Do not apply genre-average changes directly to an individual work, venue or region. The derived indicators were calculated from rounded rates of change and should not be quoted as exact figures.
Unconfirmed information
The rates of change in this article follow the figures in the supplied material and were not directly cross-checked against the body of the official KOPIS page. Detailed reporting definitions, changes in performances and bookings by genre, production scale and seat occupancy, and the share of discounted and invitation-based sales were not confirmed. The costs and profits of individual works, causal links between supply and sales changes, and the sales outlook for the next quarter were also not confirmed.
Reference material
Have a correction or additional evidence? Request a correction